Last Edited:
Dec 21, 2024
About the project
In the realm of financial markets, options trading distinguishes itself by its inherent complexity and the potential for substantial returns. Navigating the fine balance between risk and reward requires a strategic approach, and technical analysis tools and indicators serve as invaluable resources in this regard. These tools provide data-driven insights, enabling traders to identify opportunities and avoid costly errors.
Technical analysis entails the examination of securities through statistical metrics derived from market activity, such as historical price movements and trading volumes. Unlike fundamental analysis, which examines a company's financial health, technical analysis emphasizes the identification of patterns and trends within trading behaviour. When applied to options trading, it offers critical insights into market sentiment and forecasts potential price trajectories, equipping traders with a robust foundation for decision-making.
Problem Statement
Develop a dedicated page to empower traders by showcasing opportunities in the options market effectively. This page should provide advanced tools and insights for analyzing options market data, enabling informed decision-making and enhancing trading strategies
Objective of the project
Our objective was to enhance the engagement of options traders on the platform. After conducting thorough research, we identified the need for an options analysis tool to support traders in evaluating and identifying potential trade opportunities more effectively.
Goal & Solution
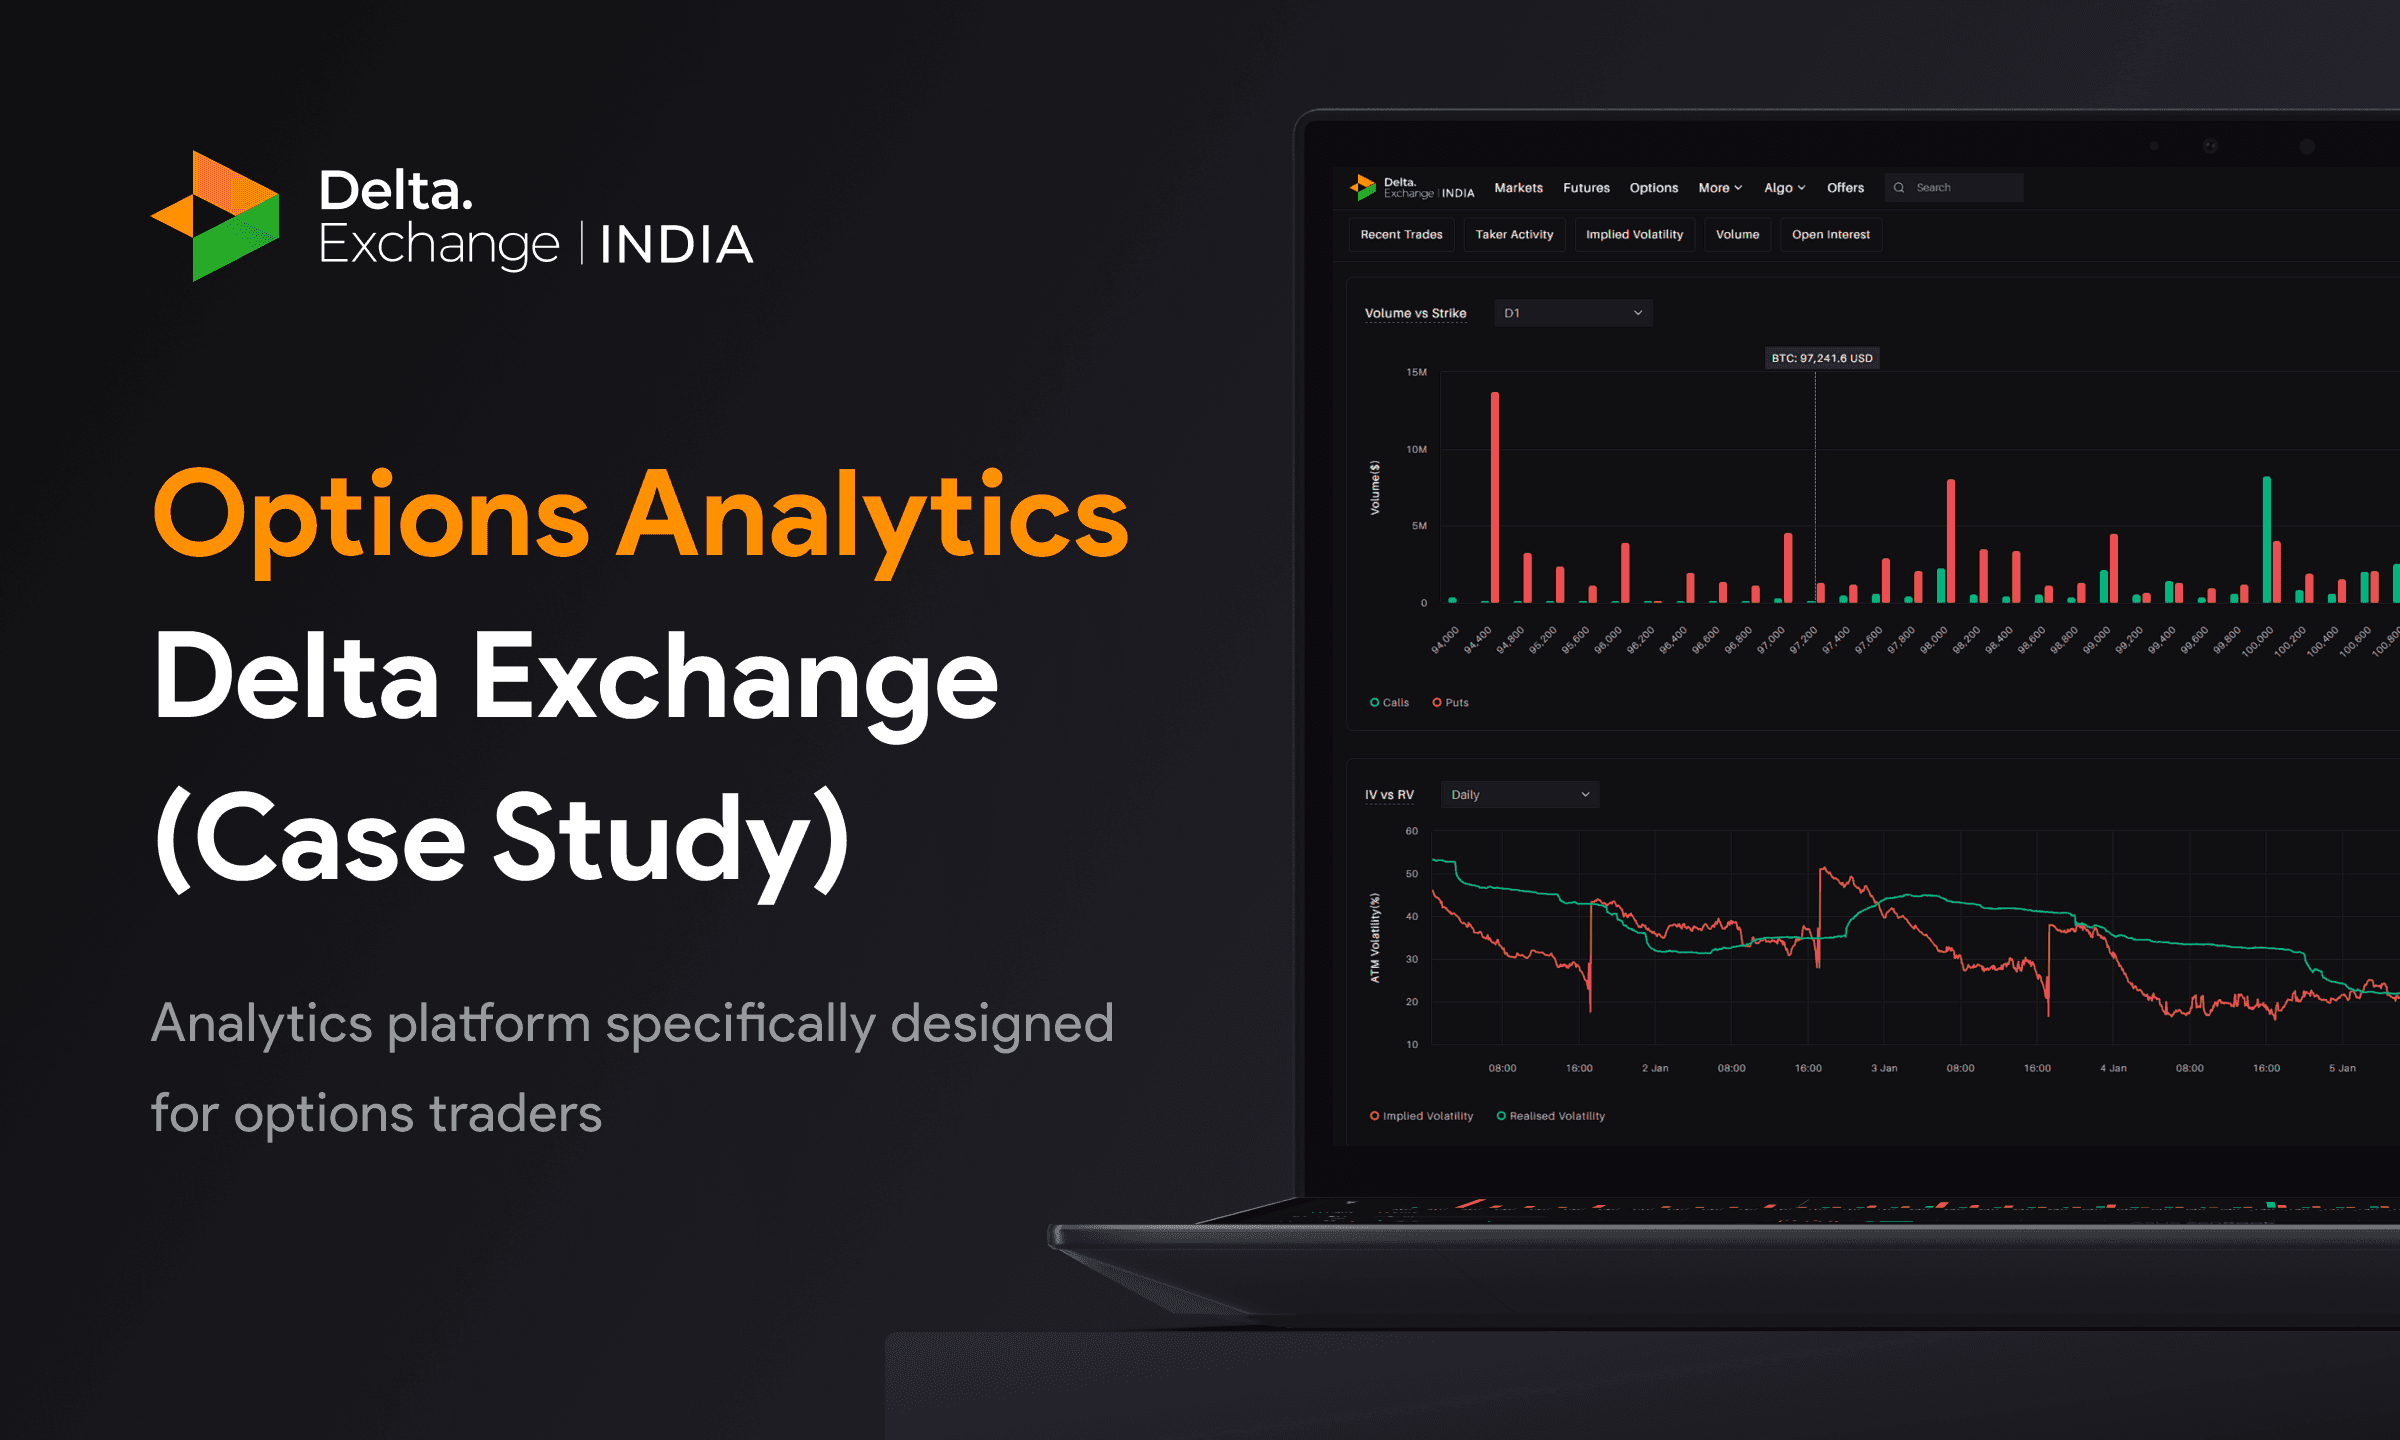
We developed an analytics platform specifically designed for options traders, named Options Analytics. This platform provides actionable insights that empower traders to make more informed decisions by identifying and evaluating trade opportunities with greater efficiency.
The option analytics page on Delta Exchange offers a summary or generalized review of the different metrics to analyse the options market.
The insights from this page provide a snapshot of market sentiment, liquidity, and potential price movements.
The information available on this page serves as a compass, guiding traders to make informed choices and optimize their strategies.

Crypto Options Trading: A Brief Overview
First, let’s go over how crypto options trading works. It is an advanced strategy that enables traders to speculate on the underlying crypto’s price movements without owning them.
An option is basically a financial contract that provides a buyer the right to buy/sell an underlying asset (cryptocurrency for a crypto option) at a predetermined price and time. Usually, people buy a call option if the price of an underlying asset will go up and a put option if they believe that prices will go down.
As a trader if you wish to limit risk and exposure to volatile markets, options are an efficient tool to achieve your goals. Moreover, you can use leverage which is an important advantage of crypto options trading. In other words, you can use a small sum to trade a large number of tokens. But, be aware of the fact that it can lead to massive losses if you are not careful.
That’s where options analytics provide users with a robust framework to evaluate and analyze potential trade opportunities.
Research and Insights
To excel in options trading, it is essential to utilize the appropriate tools and resources. After conducting comprehensive research across various financial media platforms, I have identified a selection of key tools and indicators that are instrumental in effective options analysis.
This discussion highlights five fundamental yet highly effective indicators and tools that every trader should be familiar with. These resources are designed to support more informed decision-making, enhance risk management strategies, and ultimately improve the likelihood of achieving success in the options market.

1 - Crypto Options Chain?
A crypto options chain is a table that lists all the available options contracts – both call and put options, for a given underlying crypto asset. It typically includes information such as the bid price, bid quantity, ask price, ask quantity, and expiration date for the contracts that are listed on the chain.
Key Takeaways:
Reading an options chain data helps assess market sentiment, identify support and resistance levels, and gauge the volatility of the underlying crypto. An option chain has two sections: calls and puts. A call option gives the right to buy a stock while a put gives the right to sell a stock.
The price of an options contract is called the premium, which is the upfront fee that an investor pays for purchasing the option.
An option's strike price is also listed, which is the stock price at which the investor buys the stock if the option is exercised.
Options list various expiry dates, which impact an option's premium.
Let’s say you’re interested in trading options on a crypto currently trading at ₹1,000. By looking at the options chain, you can see the available call and put options at various strike prices, such as ₹950, ₹1,000, and ₹1,050, with expiration dates ranging from a few days to several months.
For example, if you believe the crypto price will rise to ₹1,050 in the next month, you might consider buying a call option with a strike price of ₹1,000 and an expiration date one month away. The options chain will show you the premium for this option, allowing you to assess whether it’s a good trade.

2 - Implied Volatility (IV)
What Is Implied Volatility in Crypto Options?
Implied volatility (IV) is a crucial metric often utilized by options traders to forecast the price fluctuation magnitude of an underlying asset till its expiration. In simple terms, implied volatility indicates how volatile the market price of an asset can be in future.
Unlike historical volatility which measures the realised volatility of a cryptocurrency’s price, implied volatility only measures the expected price movements based on an option’s price. It is called ‘implied’ because it is the future volatility implied by the crypto market for a crypto option. This metric is derived from the Black Scholes formula for pricing options.
How Does Implied Volatility Work in Crypto Options Trading?
In crypto options trading, implied volatility refers to a forecasted value by which the price of the underlying asset is expected to fluctuate. It is directly proportional to the expected crypto price; hence, it’s an essential factor for options pricing.
The higher the implied volatility more will be the option prices. Similarly, a lower implied volatility means lower option prices due to its direct correlation. You can effectively use it in various ways while trading in crypto options, which include:
Estimating option prices
Computing the expected price movement of an underlying asset
Assessing the risk in a particular direction
As there is a strong speculation element which drives the crypto prices volatile. Therefore, the risk of losses is also very significant. Traders can check an option’s implied volatility to understand price fluctuations taking market risk into consideration. Usually, a higher implied volatility happens during a bear market, while a lower implied volatility occurs when the market is bullish.

3 - Open Interest (OI)
Open Interest (OI) is a metric that represents the total number of active positions in a specific contract.
OI tracks the total number of outstanding derivative contracts, either options or unsettled futures. Essentially, it monitors the total number of currently active participants, rather than the total trading volume, which includes both open and closed positions. This distinction is crucial as it helps traders understand if new resources are being allocated to the contract, or if resources are being redirected elsewhere.
Open Interest (OI) is a tool that monitors the total number of open positions in a specific cryptocurrency contract.
OI provides information about the liquidity and interest in a particular contract, assisting traders in understanding market trends.
Changes in OI can indicate whether new resources are being allocated to the contract or if resources are being redirected elsewhere.
The Role of Open Interest in Market Trends
In futures and options trading, traders often look at open interest, along with other data points, to determine the strength of a price trend.
If open interest increases, it shows new contracts are initiated, which many analysts view as confirmation of the trend.
Conversely, a decrease in OI suggests traders are closing their positions, indicating that the trend may come to an end soon.
For example, if the open interest of a Bitcoin option is currently 6, and an investor initiates 10 contracts of that option, the open interest of this specific option is now 16. If another trader closes 3 of these outstanding contracts, while the investor initiates another 5, the open interest increases by 2, bringing OI to 18. As you can see, closing positions decrease OI, while initiating positions increase it.

The Importance of Open Interest in Crypto Trading
By keeping an eye on changes in open interest, traders can assess the changing sentiment and possible future movements in the cryptocurrency futures market. This information forms the foundation for various trading strategies, providing traders with information about market sentiment and potential trend developments.
For instance, if prices are rising along with an increase in open interest, it points to a strong trend and possible upward momentum. This alignment supports confidence in the general market sentiment and represents a consensus among market participants.
Conversely, if open interest increases in the face of declining prices, it suggests that the downward trend may continue. This alignment indicates ongoing selling pressure and traders’ agreement on the gloomy outlook.
By understanding and tracking open interest, traders aim to make more informed decisions and potentially improve their trading strategies.

4 - Option Greeks
Option Greeks are a set of metrics that help traders understand how different factors affect the price of an option. The most important Greeks are Delta, Gamma, Theta, Vega, and Rho. Each Greek provides insight into a specific aspect of the option’s risk and potential reward.
Delta (Δ): Measures the sensitivity of the option’s price to changes in the price of the underlying asset. For example, if Delta is 0.5, the option’s price will increase by ₹0.50 for every ₹1 increase in the underlying asset’s price.
Gamma (Γ): Measures the rate of change of Delta as the underlying asset’s price changes. High Gamma indicates that Delta will change rapidly with small price movements, making the option more sensitive.
Theta (Θ): Represents the time decay of an option. Theta indicates how much the option’s price will decrease each day as it approaches expiration. For example, if Theta is -₹0.02, the option’s price will decrease by ₹0.02 each day, all else being equal.
Vega (ν): Measures the sensitivity of the option’s price to changes in implied volatility. If Vega is ₹0.10, the option’s price will increase by ₹0.10 for every 1% increase in implied volatility.
Rho (ρ): Measures the sensitivity of the option’s price to changes in interest rates. Rho is less commonly used but can be important in certain market conditions.
➝ Practical Tip: Use the Greeks to analyse the risk and potential reward of your options trades. For example, if you’re concerned about time decay, look at Theta to understand how much value your option will lose each day.

5 - Support and Resistance Levels
Support and resistance levels are critical technical analysis tools that help traders identify potential price points where the underlying asset might experience buying or selling pressure. Support is a price level where a stock, asset or crypto tends to find buying interest, preventing it from falling further. Resistance is a price level where selling pressure is likely to emerge, preventing the price from rising further.
How to Use Support and Resistance Levels
Suppose a crypto is currently trading at ₹1,000 and has strong support at ₹950 and resistance at ₹1,050. If you believe the crypto will bounce off the support level and rise towards resistance, you might consider buying a call option with a strike price near ₹950. Conversely, if the crypto is near resistance and you expect it to decline, you might consider buying a put option with a strike price near ₹1,050.
➝ Practical Tip: Use support and resistance levels to time your entry and exit points when trading options. This can help you increase your chances of success by aligning your trades with key price levels.
Identifying Support and Resistance Zones in Crypto Options Chain Data
To identify resistant and support zones using open interest while reading an options chain:
Look for strike prices where the call open interest is higher than usual. These are areas where there is a lot of selling pressure, and the price is likely to face resistance.
Look for strike prices where the put open interest is higher than usual. These are areas where there is a lot of buying pressure, and the price is likely to find support.
Once you have identified resistance and support zones through option chain data analysis, you can use this information to make informed crypto options trading decisions.
Design Actions
With our research and insights established, the next step was to translate these findings into visual and UI designs. In creating a technical analysis tool, our goal was to present complex data in an interactive and intuitive way, enabling traders to effectively identify and analyze trading opportunities through graphical representations.
To achieve this, we organized and categorized the graphs to be represented as follows:
1 - Open Interest
The Open Interest chart displays the total number of outstanding option contracts across various strike prices. Selecting multiple maturities simultaneously adds up the open interest for each selected expiry on the particular strike.
When a strike price shows high open interest levels, it may suggest that traders and investors are anticipating potential price movements in the underlying asset. Conversely, low open interest levels may indicate a lack of market interest or confidence in the asset's direction at that particular strike price.
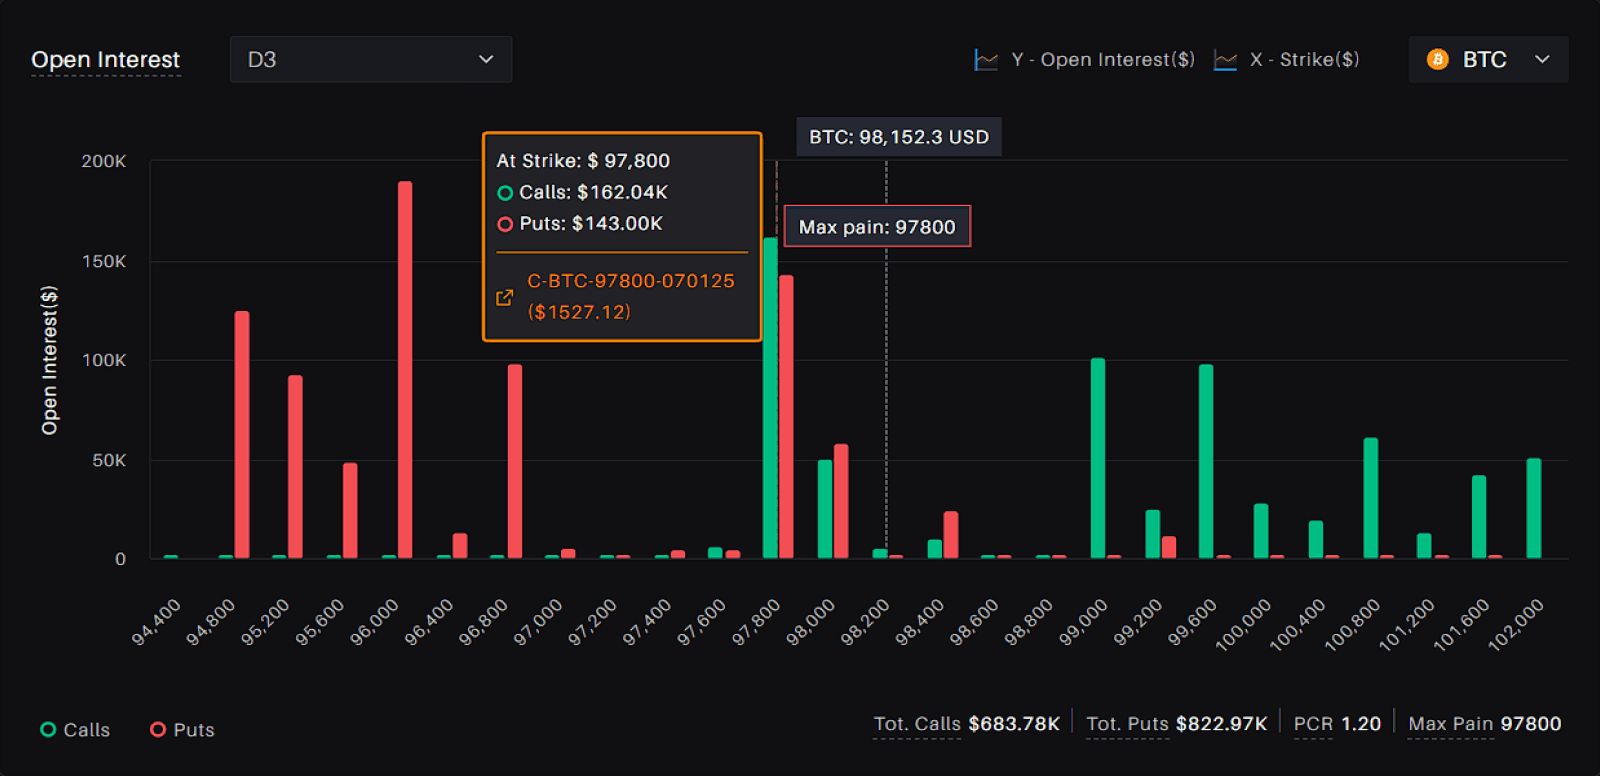
In the case of call options, high open interest levels are often treated as resistance, while these levels for put options are regarded as support.
Traders can use this chart to identify the underlying asset's potential support and resistance levels and gain insights into the market's expectations of future price movements.
2 - Open Interest Change
The Open Interest Change chart displays the changes in the total number of outstanding Call and Put options contracts across various strike prices. Users can select multiple expiration dates to see the cumulative changes over a specific time period.
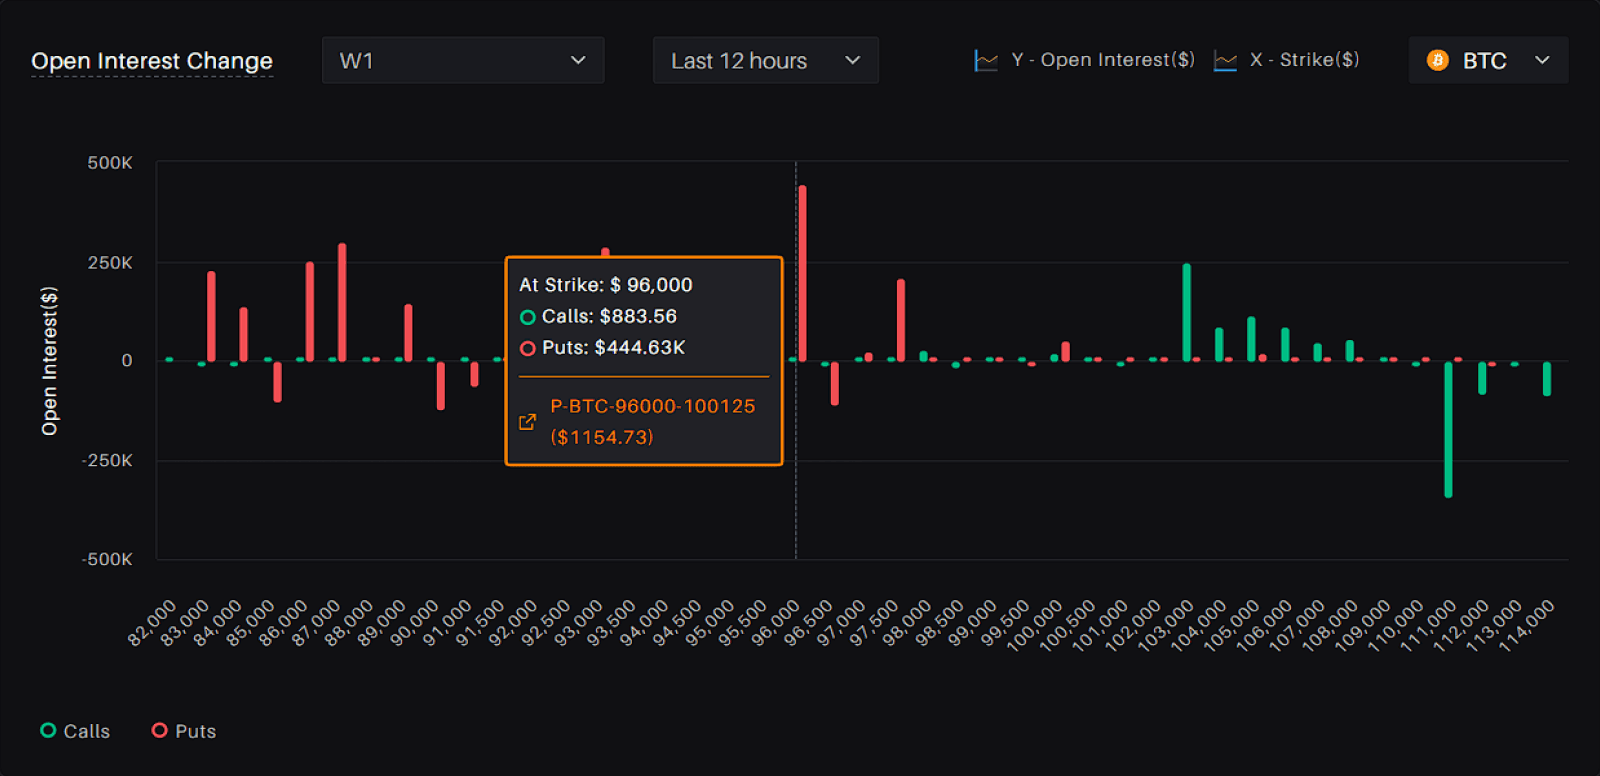
Traders can use this chart to identify potential trends and changes in market sentiment that may inform their trading decisions. For instance, If the open interest at the strike with the highest open interest decreases while the market is going up, the supposed resistance level may become obsolete. The decrease in open interest at a particular strike could be a sign of depleting confidence of call writers in the market resistance at that strike.
3 - Volume vs Strike
The Volume vs. Strike chart displays the 24-hour trading volume for call and put options across various strike prices.

Traders can use this chart to identify the most actively traded strike prices for a particular maturity. Understanding the volume distribution across different strikes can provide insights into the market's consensus on the most likely price range for the underlying asset.
4 - Implied Volatility
This graph represents the implied volatility values for options across a range of strike prices with the same expiration date.
In many cases, this graph will show a skew or smile shape, where the implied volatility values for options that are further out of the money are higher than for options at the strike price closer to the underlying instrument's price. This is why it is also called “Volatility Skew.”

This is often the case because out-of-the-money options are more sensitive to changes in the underlying asset's price, which means that they are typically more volatile and, therefore, command a higher implied volatility premium.
Traders and investors can use the volatility skew to gain insights into the market's expectations of future price movements for the underlying asset and identify potential trading opportunities, such as buying or selling options, using spreads, or making directional trades.
5 - Implied Volatility(IV) vs. Realized Volatility(RV)
The Implied Volatility vs. Realized Volatility graph plots the implied volatility of an option contract against the realized volatility of the underlying asset over a specific period. Implied volatility is the market's expectation of how much the price of the underlying asset will fluctuate in the future, whereas realized volatility is the actual historical volatility of the underlying asset over a given period.
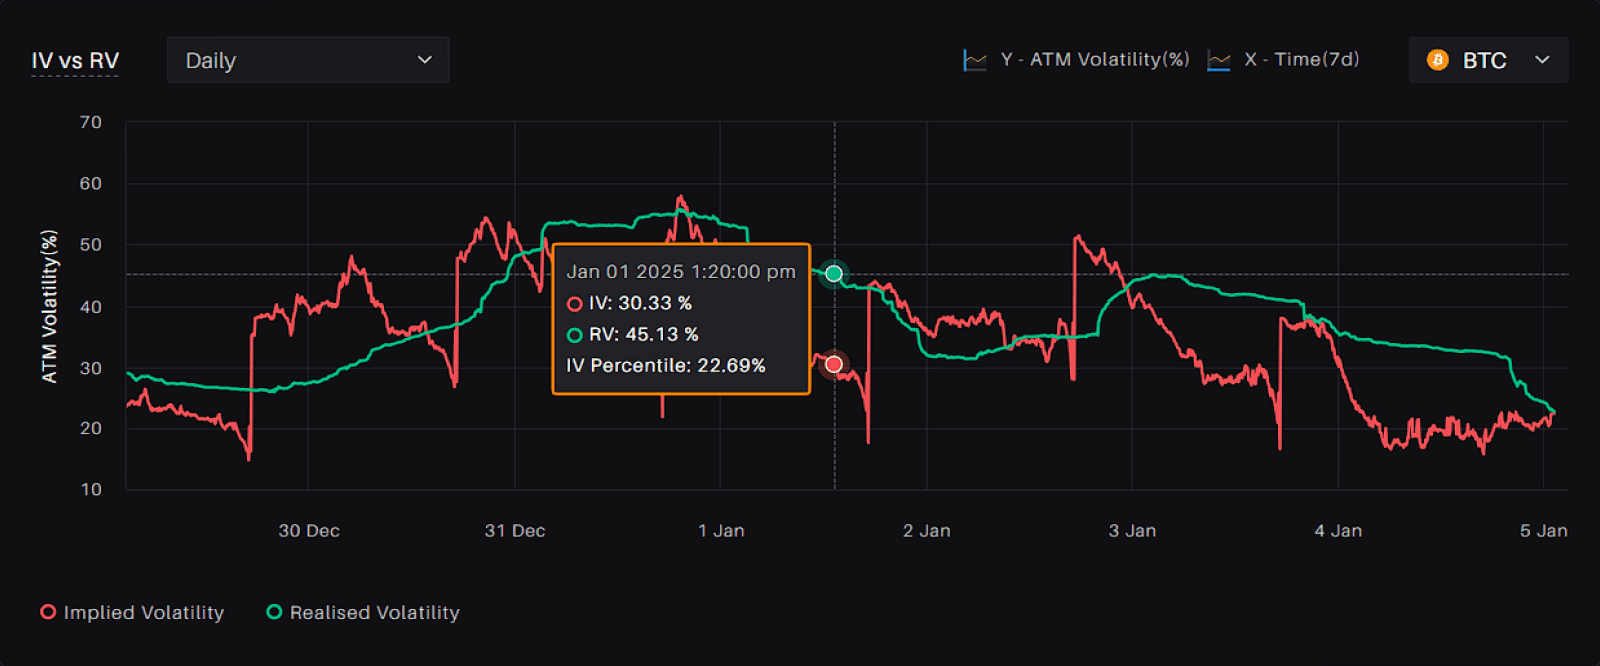
Traders and investors can use the Implied Volatility vs. Realized Volatility graph to identify potential trading opportunities, such as buying or selling options, depending on their market outlook and risk tolerance. For example, if the realized volatility is consistently higher than the implied volatility, traders may consider buying options to take advantage of potential price movements, while if the realized volatility is consistently lower than the implied volatility, traders may consider selling options to generate income from the premiums.
6 - Implied Volatility(IV) - Realized Volatility(RV)
The Difference of Implied and Realized Volatility graph plots the difference between implied and realized volatility of the underlying asset over a specific period. It can be used with IV vs. RV graph to gauge the rarity of the opportunity in the market. 1 SD line represents one standard deviation of the difference graph.

In a normally distributed sample, 68% of the points lie between +1 SD and - 1 SD from the mean and 95% between +2 SD and -2 SD from the mean.
Traders can capitalize on such opportunities by trading straddles (Move contracts on Delta Exchange).
If the trader expects the realized volatility to be lower than the implied volatility, they will sell the straddle and vice versa.
7 - Taker Activity
The Taker Flow Chart displays real-time taker activity in the options market. Takers are market participants who take an existing order off the order book.
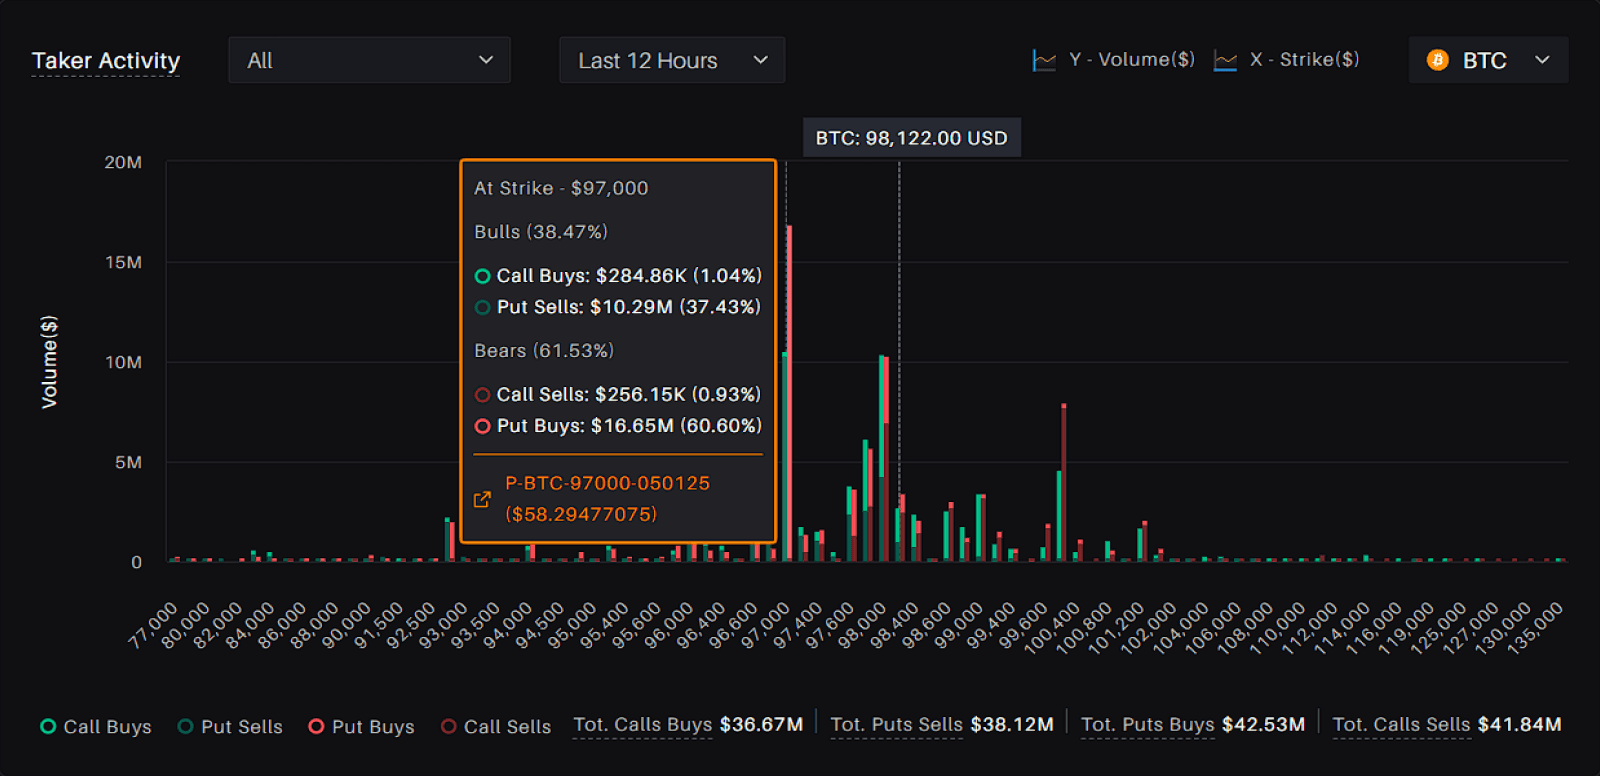
The chart shows bearish and bullish activity in the options market through red and green bars, respectively. The red bars represent activity in call sells and put buys, while the green bars represent activity in put sells and call buys.
The chart can also be used to contrast the taker's view with the maker's view. Makers are market participants who provide liquidity by placing orders on the order book. By comparing the taker’s activity with the maker's, traders can gain insights into the supply and demand dynamics of the options market and make more informed trading decisions.
8 - Recent Options Trades (upto Last 500 trades)

Final Designs and Usage
Closing Thoughts
Data-driven decision-making has emerged as a fundamental pillar of effective strategy development in Options trading. By leveraging the comprehensive insights available on Delta Exchange Options Analytics page, traders can analyze key metrics and market trends with precision. This data empowers them to make informed decisions, optimizing their trading strategies to align with market dynamics.
Such an approach not only enhances a trader’s ability to navigate the inherent volatility and complexity of the Options market but also fosters a deeper understanding of its underlying framework. Armed with actionable analytics, traders can identify opportunities, mitigate risks, and adapt to shifting market conditions with greater confidence and clarity.


